AI for exploration targeting and prioritisation

Confidence first — drilling second

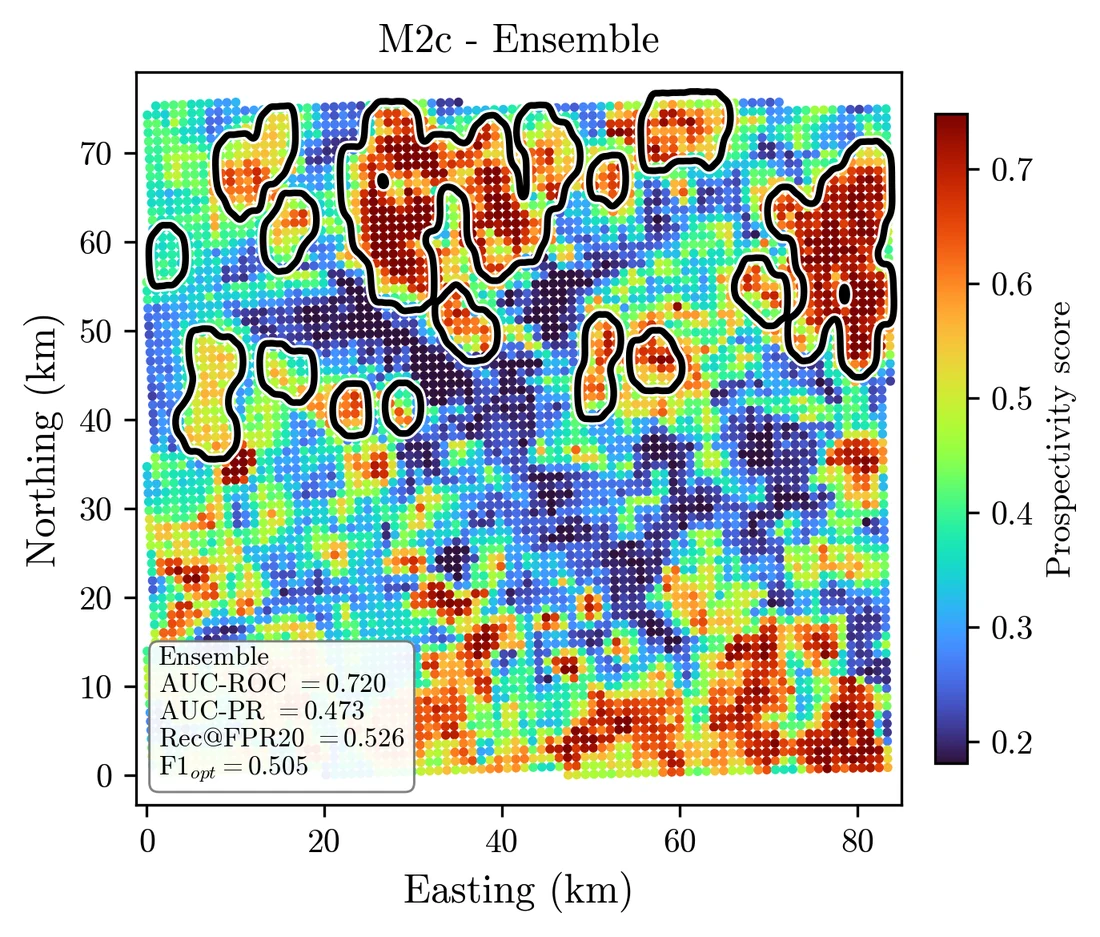
We bring together everything known about a territory — geological, geophysical, geochemical and satellite data — in a single model. It identifies prospective areas, quantifies forecast uncertainty and shows which factors drove each result. The resulting prospectivity map and ranked list of targets help focus drilling on the best-substantiated areas and cut costs.

only 0.5%
of greenfield exploration targets lead to a significant discovery¹
only 5%
of brownfield targets near known deposits are confirmed by drilling¹
$4–9M
the cost of one failed exploration target²

¹ Diaz S. et al. Analyzing mineral exploration efficiency: too little for too much? Evidence from project valuations and implied discovery probabilities // Mineral Economics. 2026. Vol. 39. P. 525–537.

² Based on Rosnedra data, project list for 2024–2026.

0.866 AUC-ROC of the ensemble map

Our model separates prospective ground from background well: in validation, a known ore occurrence ranks higher than a randomly chosen background area in roughly 87 cases out of 100.

How the model works

The full path: territory data layers → patches → neural network → prediction, uncertainty and target maps
  1. 01

    Verified data

    Survey archives, geology, geophysics, geochemistry, satellite imagery, terrain, hyperspectral

  2. 02

    One dataset

    The territory is cut into patches; every layer is brought onto one grid

  3. 03

    Analysis

    A model ensemble and the analog-deposit principle; every conclusion explainable and reproducible

  4. 04

    Forecast

    Maps of prospectivity, uncertainty and overall priority

  5. 05

    Validation targets

    A short ranked list of areas and a geological justification down to the drilling grid

Technology

Why the model can be trusted

Source data for the dataset

Data layers of one territory: imagery, terrain, geophysics, geochemistry, structures — and the resulting targets

Geology

We bring geological maps and data of different scales onto one spatial grid. Lithology, rock age and composition, intrusive bodies, dykes, faults, contact zones and hydrothermal alteration are encoded separately. These features help the model account for the geological framework, ore-controlling factors and the spatial relationships typical of ore objects.

Multispectral data

We use Landsat and ASTER imagery in the visible, near-, shortwave- and thermal-infrared ranges. We compute spectral features linked to hydrothermally altered rocks, clay and hydroxyl-bearing minerals, iron oxides, carbonates and silica. These data help the model detect metasomatic zones and mineral associations characteristic of different mineralisation types.

Terrain and tectonics

A digital elevation model and its derivatives, lineaments, faults and their intersection nodes. These data help the model account for structural control of mineralisation, identify zones of increased fracturing and possible pathways of ore-bearing fluids.

Radar and hyperspectral

We use Sentinel-1 SAR imagery, polarisation channels and their ratios, plus backscatter texture features. They help reveal linear structures, fracture zones and terrain features. Hyperspectral data make it possible to recognise diagnostic mineral absorption bands and refine the extent of clay, hydroxyl-bearing, carbonate and iron-bearing phases associated with hydrothermal alteration.

Geophysics

Airborne magnetic, gravity and other surveys are brought to a common spatial format and enriched with derived features.

Geochemistry

We use geochemical data covering dozens of chemical elements. We analyse individual anomalies, multi-element geochemical associations, zoning and the spatial relationships of indicator elements, plus composite features and indices. This helps the model detect dispersion halos and signatures of ore-metasomatic systems.

The analog-deposit principle

“There must always be a reference deposit: we must understand what we are looking for” — that's how a geologist works. Cratona works on the same principle: the model searches for areas with a similar setting across all data layers at once.

An ensemble, not a single model

We compare seven architectures — from Random Forest to convolutional networks with FiLM geochemistry fusion — and work as an ensemble. Convolutional models see the texture and arrangement of features, not just their averages, and transfer better to new territories.

SHAP feature group importance for all models
Explainability (SHAP). Every prediction is broken down by data group: you can see what the model relied on and why it flagged a specific area. Results are presented in a format a geologist can read without any machine-learning background.

MC-Dropout — uncertainty estimation

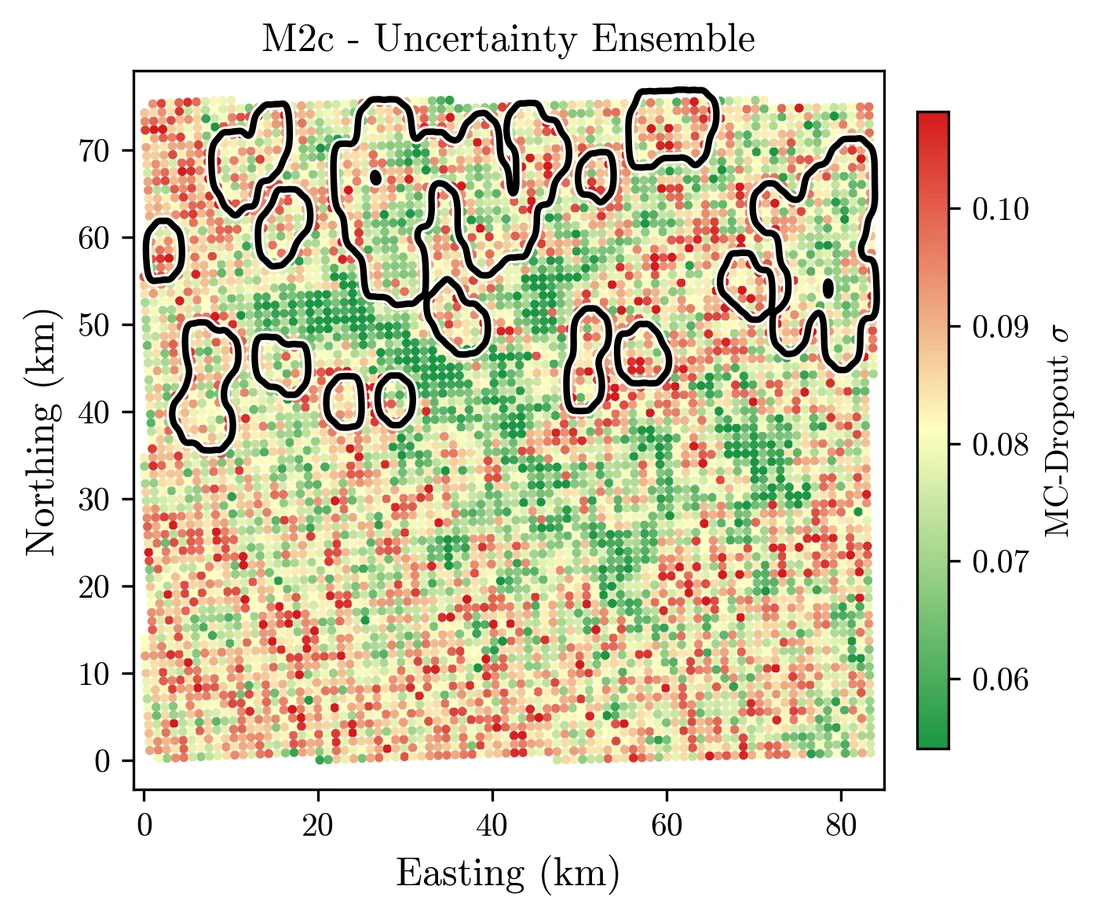
The model runs the prediction 20 times with a random part of the network switched off. If the results repeat, the forecast is considered stable. If the estimates differ noticeably, the area is flagged as a zone of elevated uncertainty.

LORO-CV — testing on new territories

The model is trained on some regions and tested on others that were not used in training. This shows how robustly it performs beyond the source data and how well the learned patterns transfer to new areas.

Validation

Spatially independent model testing

Model quality is assessed on territory fully excluded from training. The model trains on one part of the area and then ranks patches in another, previously unused part. This reduces the risk of spatial data leakage and shows how robustly the learned patterns transfer to new ground. Below are the results of such a test on a gold exploration area of about 4,100 km².

0.866
AUC-ROC of the ensemble map: a known ore occurrence ranks above a background area in roughly 87 cases out of 100
2
southern clusters identified as first-order targets
7
model architectures compared
LORO-CV
testing on new territories: the model trains on some regions and is tested on others
How the testing works →
Priority index P1 map with southern clusters A1 and A2 highlighted
Priority index P1 = prediction × confidence. Black outlines are known gold occurrences; the gold dashed ellipses mark the two southern clusters A1 and A2 — first-order field validation targets.

Access to the demo map

The interactive prediction map is available on request. Leave your contacts — our manager will get in touch to discuss how we can work together.

Request access

Narrowing the search and exploration area

Search area reduction funnel: 4,100 km² → 410 km² of prospective zones → 6–8 exploration targets (50–60 km²) → 2–3 priority A targets (10–15 km²). Reduction by ~270x

Product

Two ways to work with us

from licence to investment-ready asset

For juniors and licence holders

We comprehensively re-evaluate a licence area using geological, geophysical and geochemical data together with remote sensing. We identify and rank prospective areas, quantify uncertainty and build an evidence base for the investment decision.

The result is an exploration target package for an investor, strategic partner or potential buyer. It substantiates the asset's prospectivity, helps plan the next stage of work and raises its investment appeal before expensive drilling begins.

  • Pre-licensing assessment of a block before the auction
  • Exploration target package for an asset sale or fundraising
  • A validation work programme tailored to your goals, risks and budget

from asset portfolio to the first drill hole

For mining and exploration service companies

We assess portfolio assets against a unified system of geological criteria to compare their prospectivity, level of study and uncertainty. For each asset we identify and rank exploration targets, find the areas with the best combination of indicators and justify the placement of first-priority drill holes.

This approach directs drilling to the most informative points, cuts the share of poorly substantiated holes and helps allocate the geological team's resources more effectively across several projects.

  • Ranking of assets and exploration targets within a portfolio
  • Justification of first-priority drilling areas and hole locations
  • Assessment of internal heterogeneity of ore zones before infill drilling

What the result includes

01

Prediction map

Probabilistic prospectivity estimates across the whole territory

02

Uncertainty map

Where the model is confident — and where the forecast needs more data

03

Priority index

Prediction and confidence folded into one ranking criterion

04

Validation target package

Ranked outlines of prospective areas with justification by each data group, uncertainty estimates and recommendations for further verification. The package includes a report describing the source data, analysis methodology and ranking criteria. Results are reproducible, verifiable and written so a geologist can read them without any machine-learning background

How we work

We work with your data, survey-fund and open sources — under NDA and with anonymised coordinates if needed. Results come in GIS formats and in the interactive viewer. A good way to start: a blind test on your archived target with a known outcome.

Team

Maxim Kozhokar

CTO

Timur Malyshkin

Remote Sensing Specialist

Discuss your territory

Tell us about your area and data — we'll suggest a format: from a blind test on an archived target to the full “data → validation targets” cycle.

arsen@cratona.ai

Send us an email — tell us about your area, data and goals.

Write to us

The button opens an email to arsen@cratona.ai in your mail client. The site does not collect or store your data.